The sediment deposition was modelled with the prototype dimensions, although a physical model study also had been carried out. Three grids were used with different sizes. The coarsest grid had 46x11 cells in the streamwise and lateral direction, respectively. The medium grid had 91x21 cells and the finest grid had 181x41 cells in the two horizontal directios. In the vertical direction, between 1 and 10 cells were used, depending on the depth. The resulting unstructured 3D grid changed dynamically as the water level changed during the simulation. The time step was set to 1000 seconds.
Five sediment fractions were used: 0.03 mm, 0.15 mm, 0.4 mm, 2 mm and 10 mm. The inflow of sediments was assumed to have 20 % of each of these five sizes. The sediment concentration at the inflow to the reservoir was assumed to be 5e-4 for each size fraction. This was a volume concentration, not a mass concentration.
Some of the figurs and videos below are from computations where more than 30 % of the reservoir is filled with sediments. This was not a situation observed in the field.
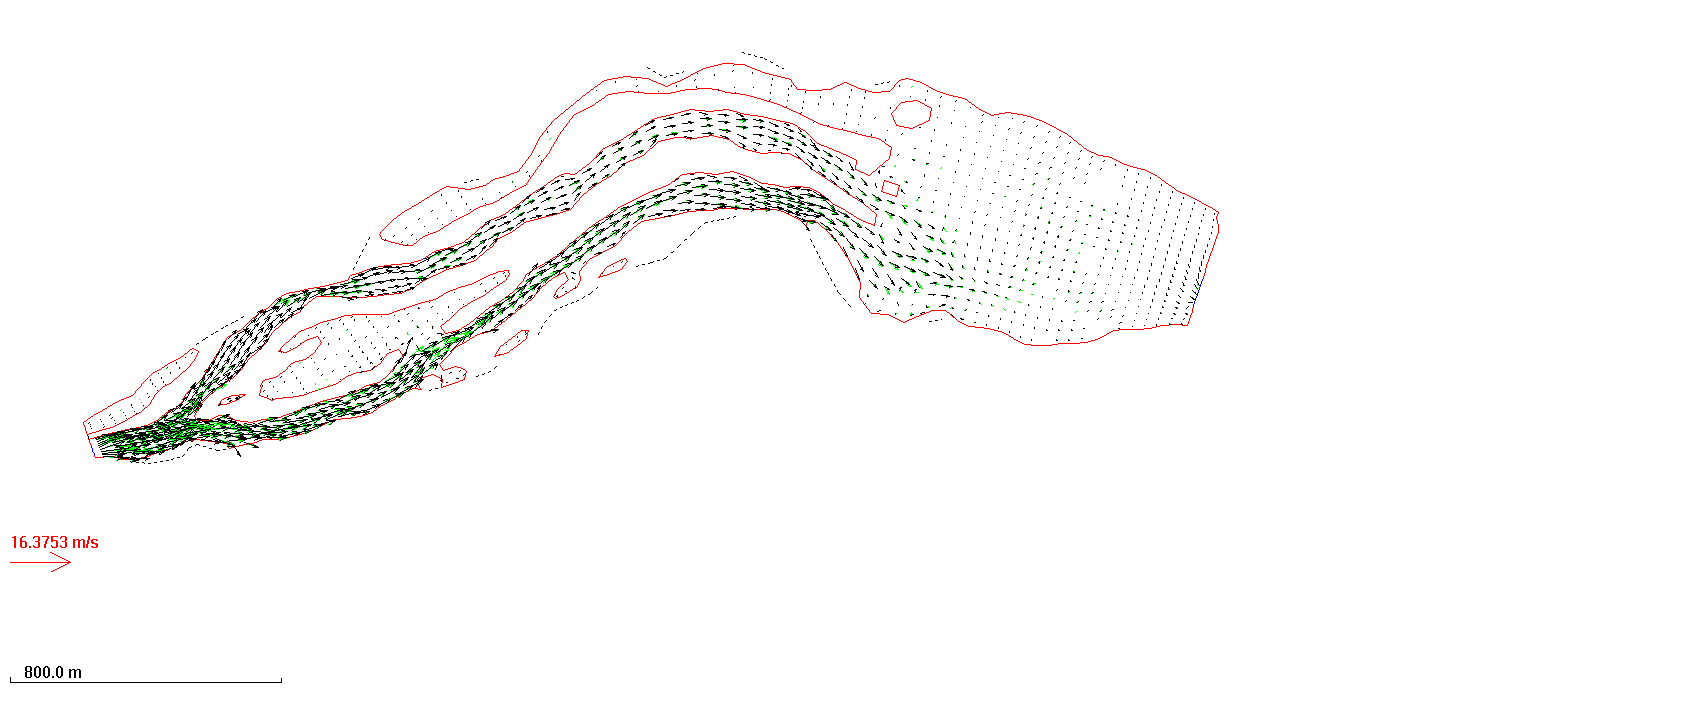
Velocity vectors for the coarse grid. The black vectors are velocities close to the surface and the green vectors are velocities close to the bed.
Video of the water depth as the reservoir fills up, coarse grid.
Video of depth and velocity as the reservoir fills up, medium grid. (5 MB)
When modelling the sediment deposition, it was observed that horizontal vortexes showed up. Some figures and videos of this process is given below.
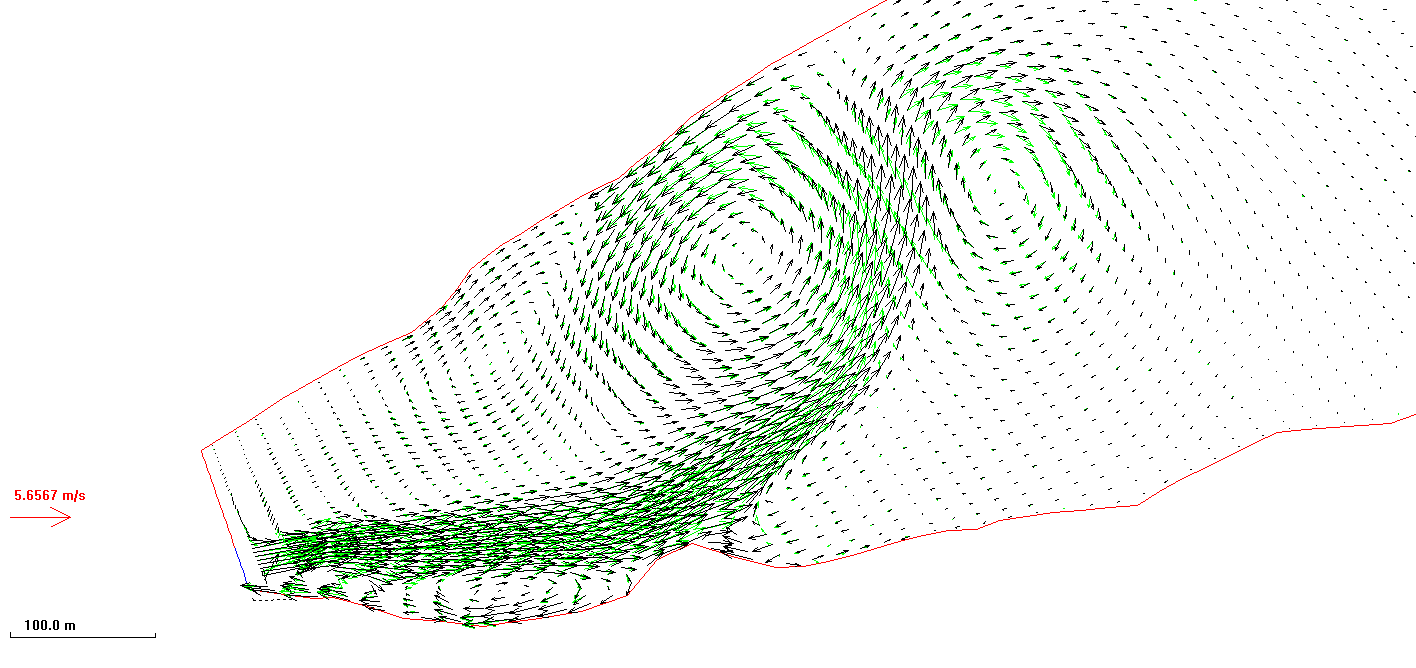
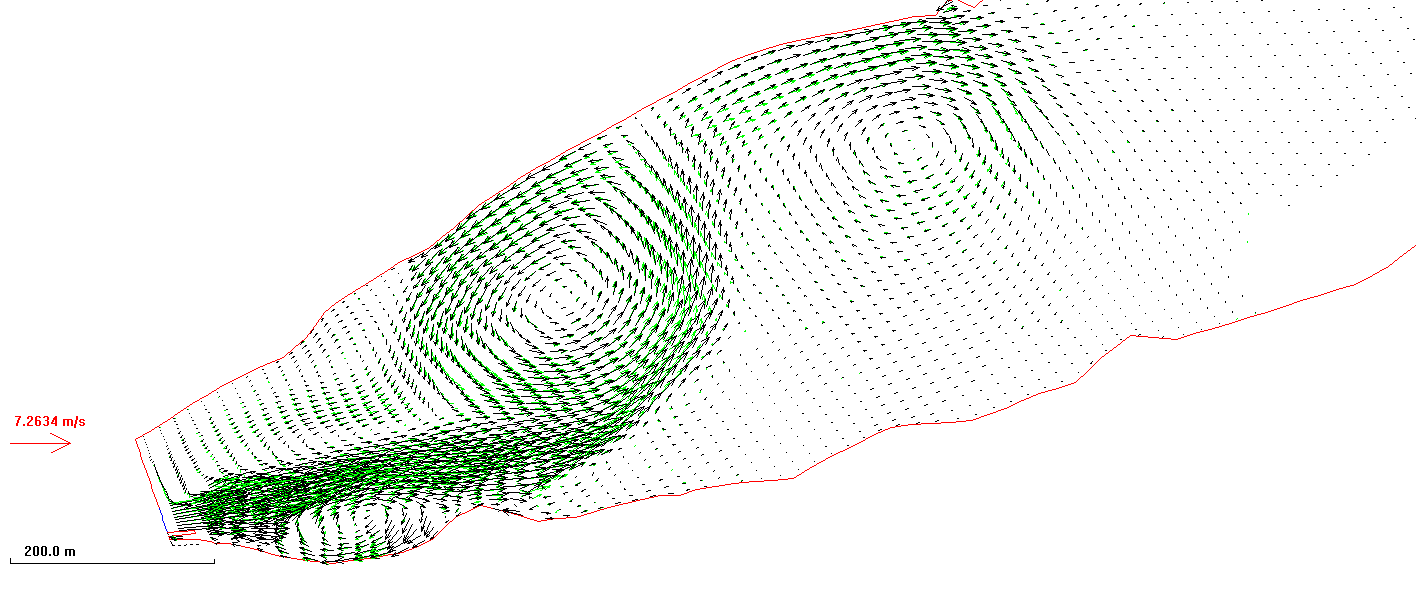
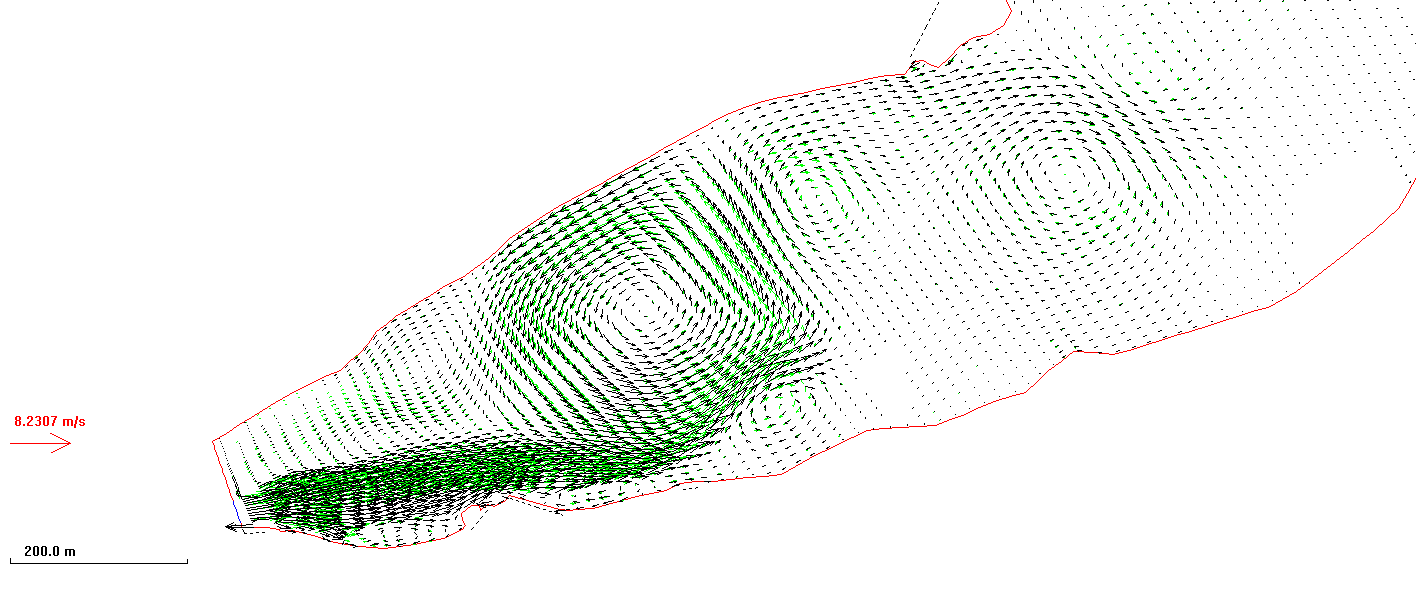
Velocity vectors at different times for the medium grid
The vortexes are also visualized in the videos below, where velocity vectors are given.
Video of velocity vectors in the reservoir as it fills up, medium grid (33 MB)
Video of velocity vectors and bed level changes in the reservoir as it fills up, fine grid (16 MB)
Video of vortexes in the reservoir as it fills up, medium grid (13 MB)
Video of vortexes in the reservoir as it fills up, finer time resolution, medium grid (180 MB)
Bromley, C., 2007. The Morphodynamics of Sediment Movement Through a Reservoir During Dam Removal. PhD Thesis. University of Nottingham, UK.
Olsen, N. R. B., 2020. Numerical modelling of sediment deposition in Lake Mills, USA. RiverFlow 2020, Delft, The Netherlands.
Randle, T.J., Bountry, J.A., Ritchie, A. and Wille, K., 2015. Large-scale dam removal on the Elwha River, Washington, USA: Erosion of reservoir sediment, Geomorphology, 246, 709-728.
The computations were funded by the Norwegian University of Science and Technology.