The purpose of the field experiment was to see how the tracer stones moved in the river. Sediment samples of the bed were taken at several cross-sections downstream of the feeding area, with 7 points in each cross-section. The sampling was done mainly by a grabber, but also some freeze-core samples were taken.
Measured tracer concentration in six cross-sections downstream of the feeding area, with linear and logarithmic vertical scales.
The location of the feeding area for the tracer is given in the figure below. The figure also shows the location of the measured points where bed samples were taken. The numbers for the cross-sections are the km distance from the upper orign of the Rhine. The same numbers are used in the figure above.
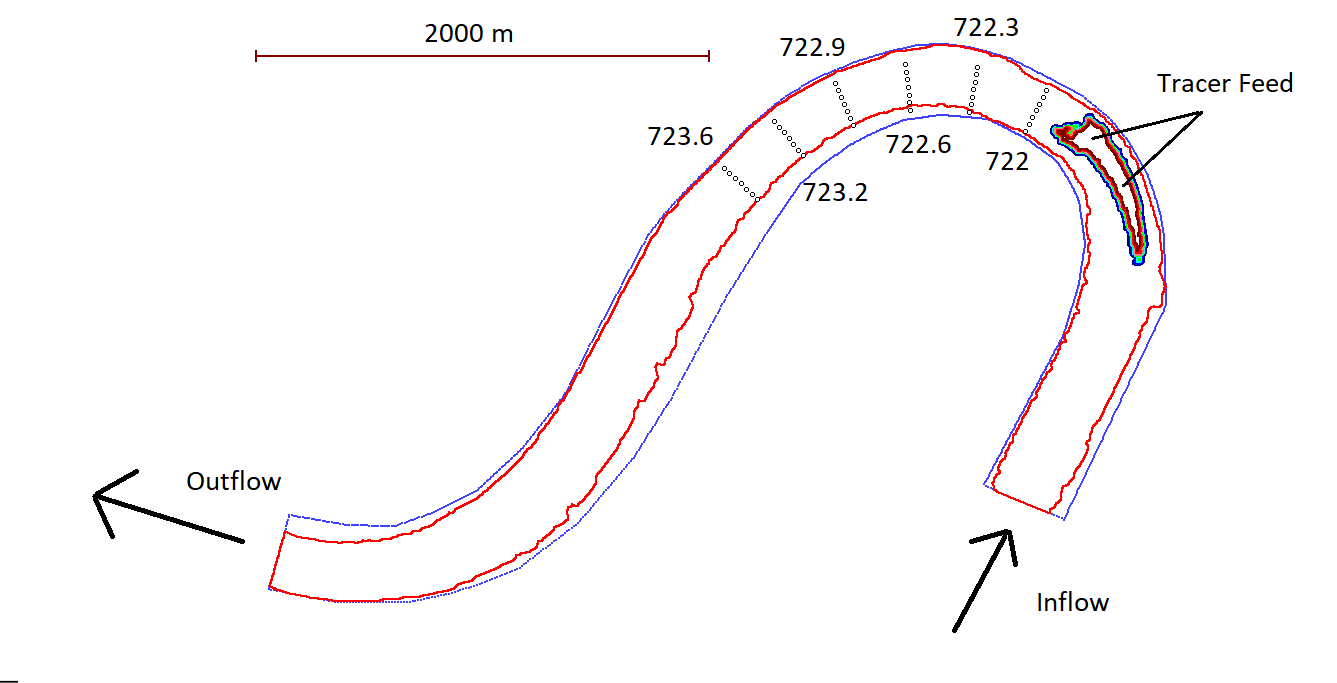
Plan view of the modelled river secontion where the initial tracer location and measured points are shown
In 2019, a collaborating project was started, with the purpose of testing a numerical model for tracer movements. The field data from the Rhine was then used to test the numerical model. The time series of discharge in the modelling period is shown in the figure below. The tracer feeding was done in the time period between 2.5 and 7.5 million seconds in the figure below. The bed sampling was done at 16 million seconds, at the end of the simulated time. The 16 million seconds is around 6 months. The feeding was done from 30th of June 2016 to 1st of August 2016. The bed sampling was done on the 14th of November 2016.
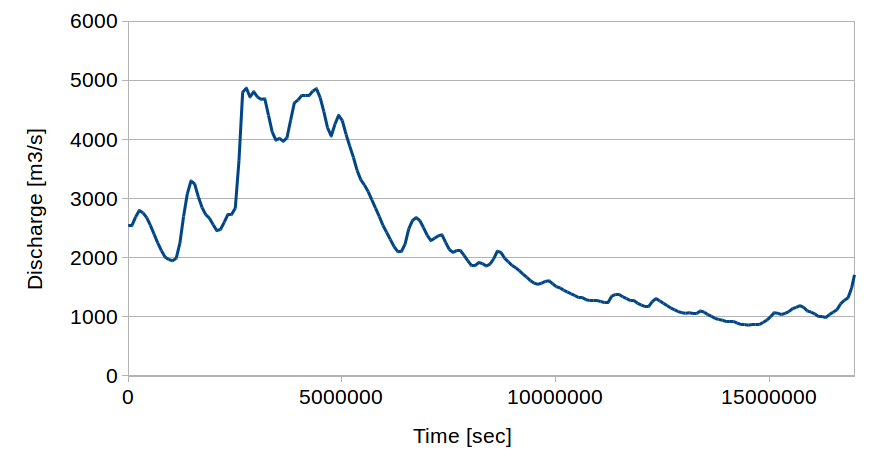
Time series of water discharge in the modelled period.
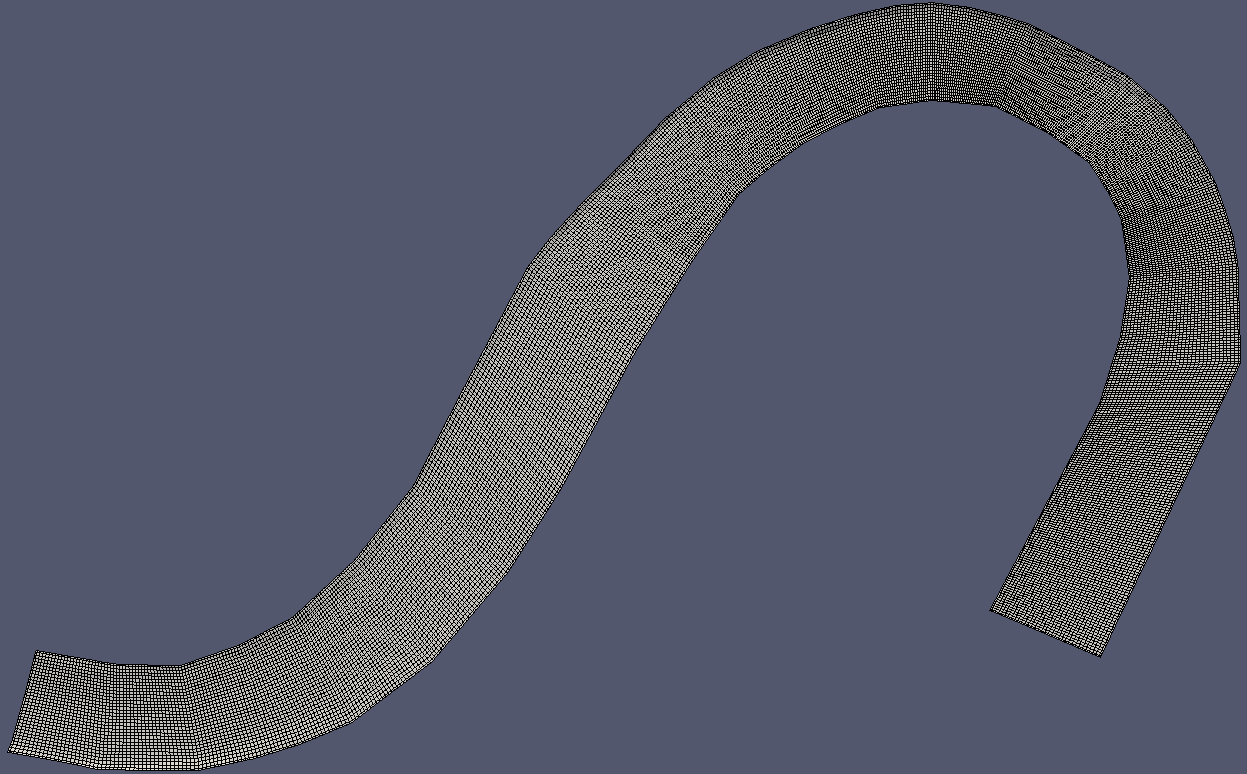
Fine grid
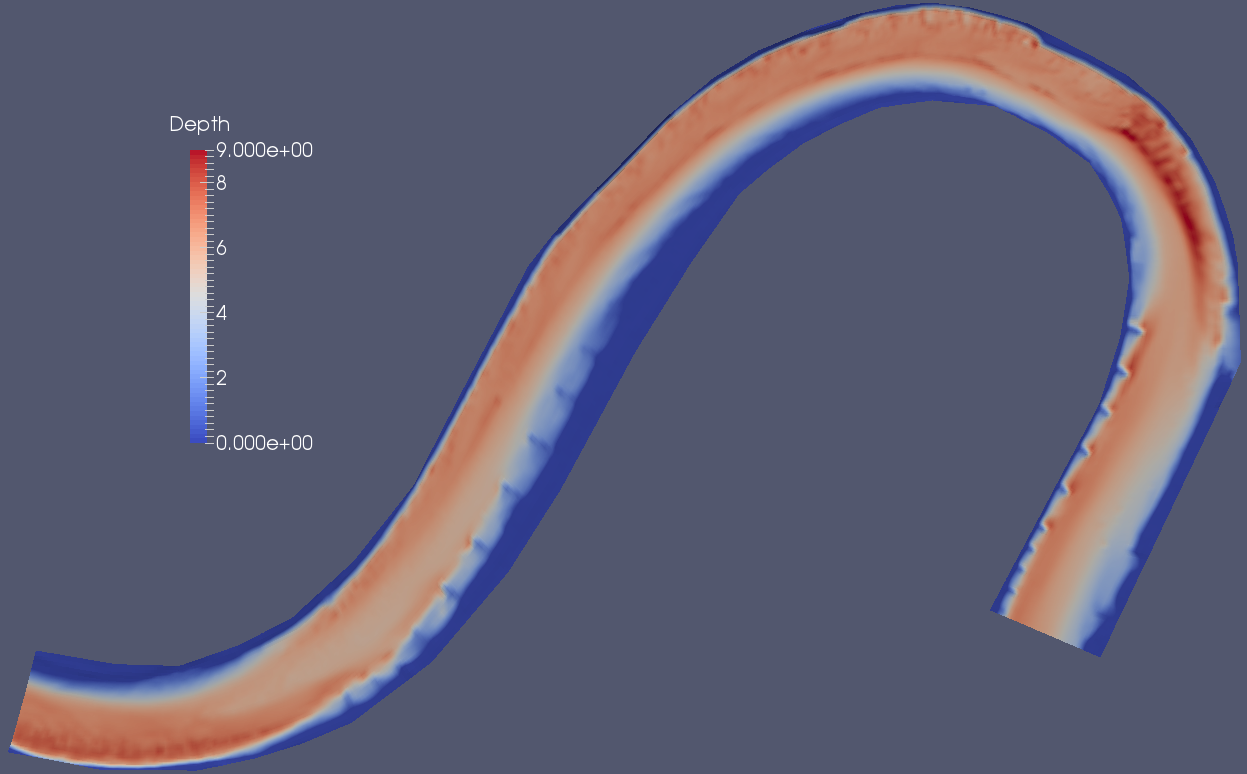
Initial water depth in meters
The bed elevation for the numerical model was taken from point samples measured with a side-scan sonar. These points were interpolated to a grid with 1x1 meters resolution, which was given as input to the numerical model. The model then interpolated the bed level in the 3D grid from these points. A linear interpolation was done.
The initial grain size distribution on the bed was taken from the FLYS database of the Bundesanstalt für Gewässerkunde. The data was obtained from samples taken over a number of years. The numerical model then interpolated the initial grain size distribution from the datbase to each cell in the grid.
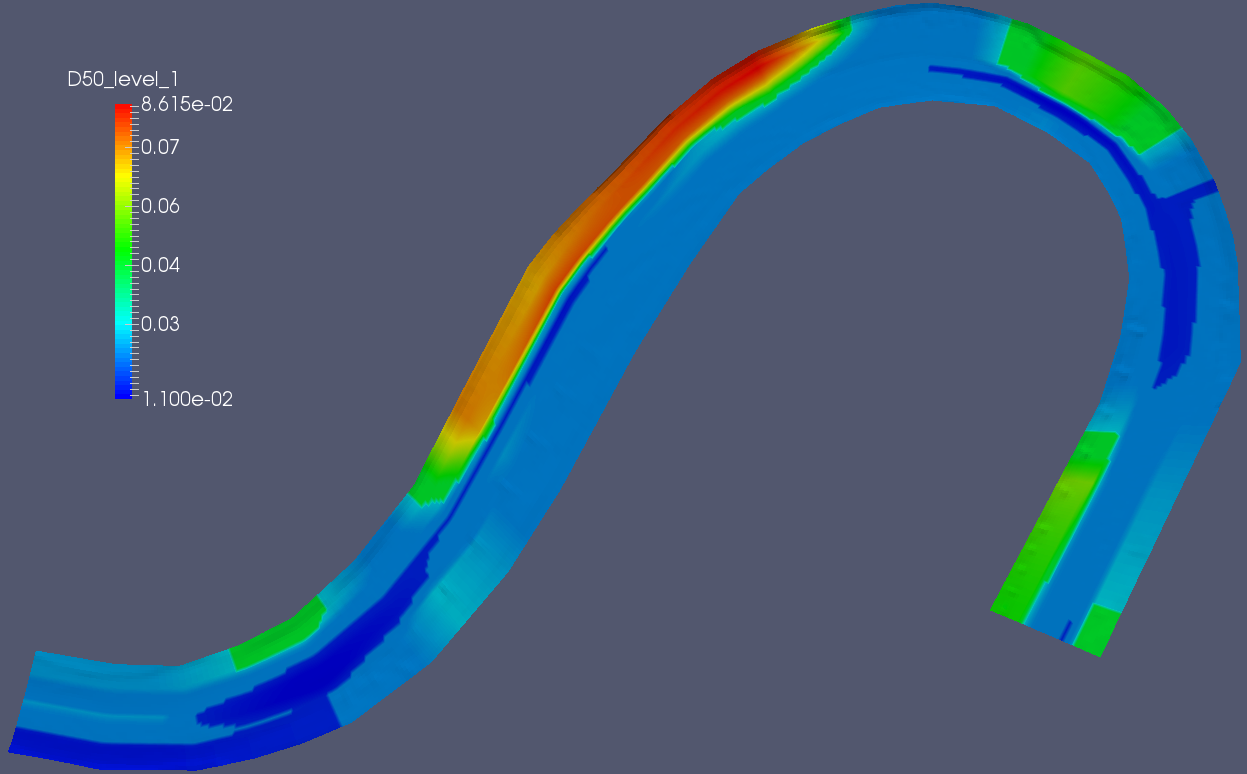
Initial grain size distribution at the bed
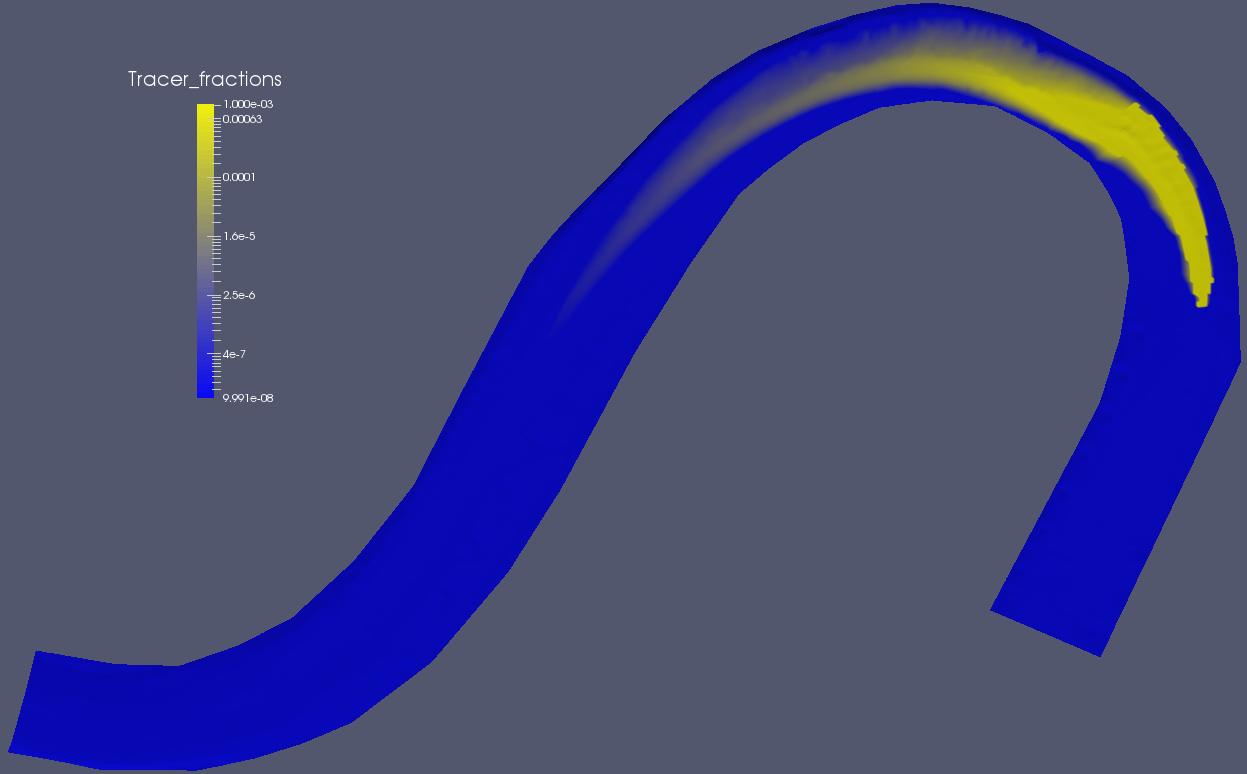
Computed tracer concentration at the bed
The dispersion of the tracer is strongly influenced by the secondary current in the bend. The figure below shows the seconary currents over the tracer feeding area with two arrows over each other. The red arrow shows the velocity vector close to the bed and the blue arrow shows the velocity vector close to the water surface. The arrows do not point in the same direction, due to the secondary current. The angle between the vectors is thereby a measure of the magnitude of the secondary current. And its direction.
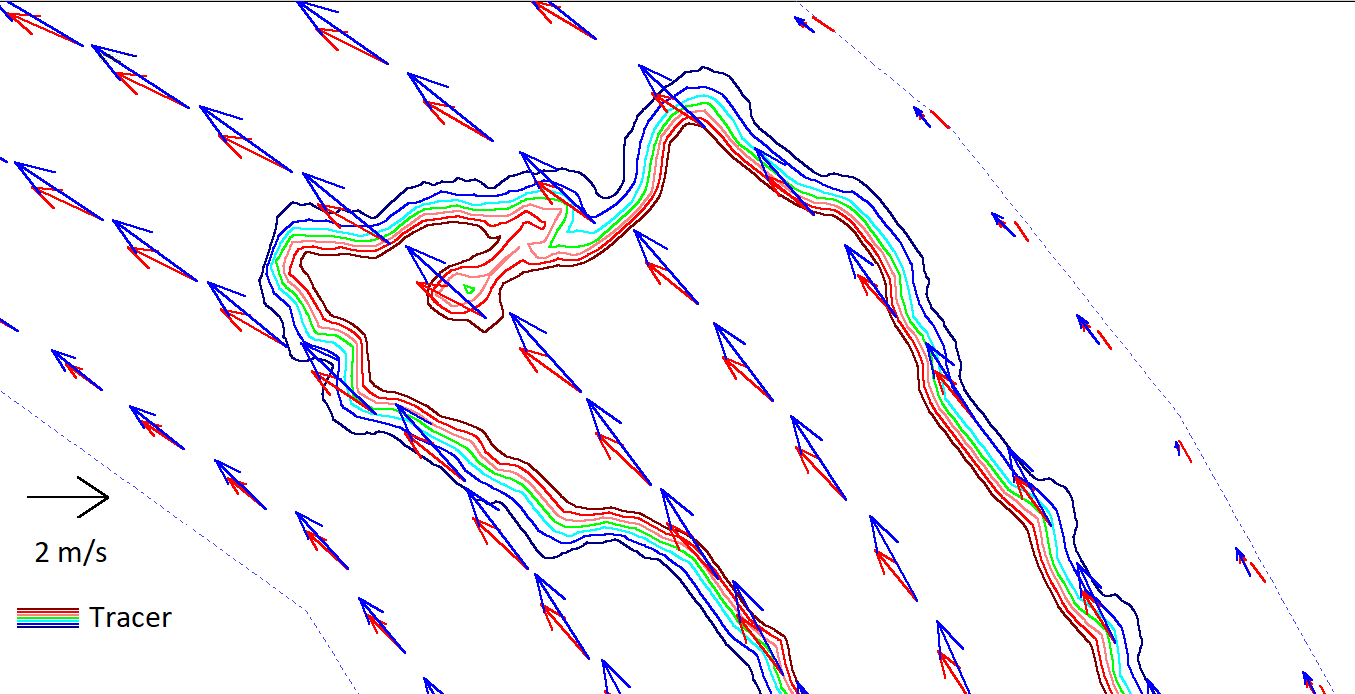
Plan view of velocity vectors over the feeding area, indicating the secondary currents.
Videos showing plan view of four characteristic parameters
The video shows the variation of water depth, water velocity bed changes and tracer fracation at the bed .
This project was carried out in cooperation with Stefan Vollmer and Dorothea Ginz at the German Federal Institute of Hydrology, together with Dietmar Pribil and Nils Hollmann at the German Federal Waterway and Shipping Administration.
This page was last updated: 12. August 2020.